Surface plotting from a set of points
sabato, Novembre 19th, 2022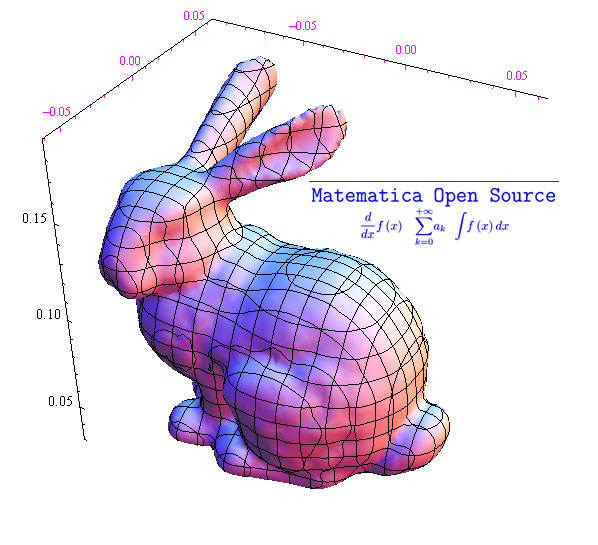
Here a real function f of two real variables x, y, is assigned, i.e. f (x, y), through the values assumed in assigned points. It is asked to draw the graph (surface in R ^ 3). Mathematica has the ListSurfacePlot3D statement which is the three-dimensional analog of ListPlot (the latter plots the graph of a function of a variable f (x)). Here are some suggestive graphics taken from the Mathematica library.


 Congettura di Riemann
 Trasformata discreta di Fourier
 Trasformata di Fourier nel senso delle distribuzioni
 Trasformata di Fourier
  Infinitesimi ed infiniti
 Limiti notevoli
 Punti di discontinuità
 Misura di Peano Jordan
 Eserciziario sugli integrali
 Differenziabilità
  Differenziabilità (2)
 Esercizi sui limiti
 Appunti sulle derivate
 Studio della funzione
 Esercizi sugli integrali indefiniti
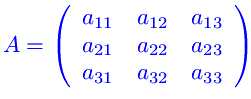 Algebra lineare
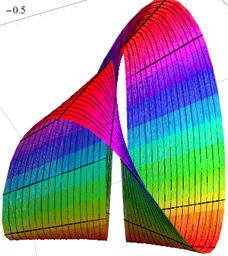 Analisi Matematica 2
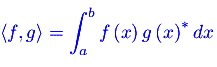 Analisi funzionale
 Entanglement quantistico
 Spazio complesso
 Biliardo di Novikov
 Intro alla Meccanica quantistica
 Entanglement Quantistico